
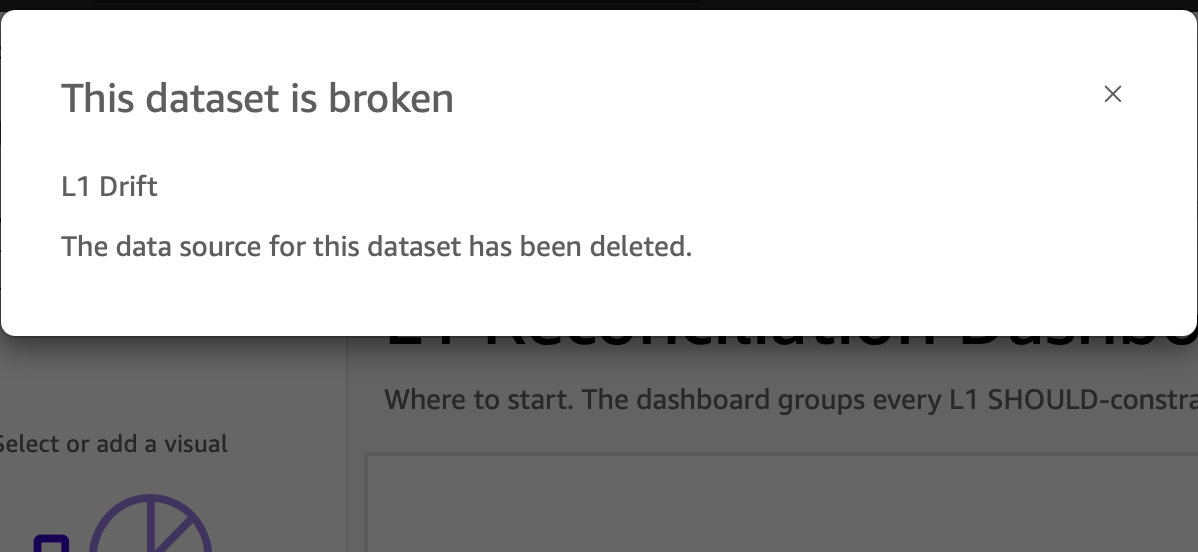
Can I please have a real error?
June 27, 2026
Debugging QuickSight.
Companion to "Death by Papercut using QuickSight" — that post is the bill this tool ran up. This one is the part of the bill that doesn't show on an invoice: the machinery I had to build just to find out when it was broken.
QuickSight's editor says it plainly: this dataset is broken. The deployed dashboard an analyst opens says nothing at all.
One of my tests told me a filter had narrowed a table to zero rows. It was lying. The table was actually showing a database error, and the test couldn't tell the difference. Neither could I, looking by hand in the browser.
That's the whole problem with QuickSight in one sentence: a dead visual looks EXACTLY like a working one. The dataset reports healthy (describe_data_set comes back CREATION_SUCCESSFUL). The underlying SQL returns rows in milliseconds when I run it by hand against the database. There's no banner, no error toast, no failed network request, no line in the console. The dashboard just spins for a while, then settles into what looks like a clean, empty table. A real "your filter matched nothing" result is byte-for-byte identical to "your query threw and QuickSight ate the exception."
So a tool that fails silently doesn't hand you a stack trace. It hands you a plausible wrong answer. recon-gen exists to catch wrong numbers in someone else's books — shipping one of my own under a control that swears it's filtering correctly is the one outcome I can't have. Everything below is what it cost to make that plausible wrong answer get loud, and it's the most QuickSight-specific engineering in the whole project.
Why I was in this box
recon-gen is independent reconciliation: it re-derives a financial institution's numbers a second way and flags where the books disagree with themselves. "Independent" only means something if it runs where the institution's analysts already live, and for a lot of shops that's AWS and it seems like it's easy to build with! — so QuickSight is one of four render targets the same dashboards generate into (the others are a self-hosted web renderer, an audit PDF and direct SQL). A release doesn't ship unless all four AGREE. That four-way agreement is the safety net under this entire post — it's the thing that turned "QuickSight is quietly wrong" from an invisible problem into a failing test, because the other three runtimes had the right answer to disagree with.
First instinct: scan for the error node (catches some of them)
When a visual fails to render, the obvious move is to look for an error element — a role="alert", a div with error in its class name, the kind of structured failure surface every web app emits. QuickSight does emit those for SOME failures, so I wrote a scanner (visual_error_text, 40a706d1) that checks a union of eight error-hint selectors scoped to the failing visual.
It earned its keep immediately. Two tables on the L1 dashboard — "Stuck Pending Detail" and "Stuck Unbundled Detail" — had each listed the same column twice, and QuickSight rejected them at render with an overlay reading "your tabular report contains duplicate columns. To proceed, remove all duplicates." That had been live and silently broken on a deployed dashboard for an entire phase. Before the scanner, the test just timed out with a generic "didn't render" and I had to reconstruct the cause from a post-mortem artifact. After it, the test failed fast with QuickSight's actual words. (The real fix went one level deeper — the table builder now refuses at construction to hold the same column twice (8cf94890), so the bug-class can't come back. The audit that fix triggered found two MORE tables with the same defect.)
So scanning for the error node works. It also set the trap, because the worst failure has no error node to find.
The extraction that actually works: read the rendered text
A chain test reported "Transactions went empty after picking ConcentrationToFRBSweep." A screenshot of the same dashboard told the truth: every visual on the sheet was rendering the sentence "Your database generated a SQL exception." QuickSight had thrown on the query and was DISPLAYING the error — as ordinary visible body text, inside the exact same container that would otherwise hold a healthy table. No error class. No role="alert". No API field. My eight-selector scanner walked right past it, because there was nothing structural to select.
This is the part that almost shipped as a passing build. The test saw no table cells, read zero rows, and concluded the filter had legitimately narrowed to empty — a wrong-but-completely-plausible diagnosis. The error was on screen the entire time, as text, and every piece of code looking for a structured error missed it.
The only extraction that works is to stop looking for a node and read the rendered text itself. The scanner (4a9fcec7) now walks every visual's innerText and substring-matches the literal English sentence "Your database generated a SQL exception." — treating the rendered DOM as the only readable error surface QuickSight will give me. It's wired into every verb that triggers a re-query, so no test can run a single assertion past a broken dataset. My note on the commit was blunter than I'd put it here: the driver has to scan for these on every page load, because without it every other test is worthless.
And there's a sneakier sibling. When a cascade control can't bind its parameter, QuickSight flags it with a small red error icon — and the actual error text lives ONLY in the title attribute of a bare <span> buried inside the control's [data-automation-id="sheet_control"] node. A title attribute is the hover tooltip — it's not in innerText and not in textContent, so you can read every visible character on the page and never find it. You query the attribute directly or you miss it entirely. The text reads, verbatim, "A calculated field contains invalid syntax. Correct the syntax and try again." — which is itself wrong, because nothing has bad syntax, the parameter just never got bound. The only way to learn WHICH control broke is a second attribute QuickSight stamps next to it, data-automation-context, holding the parameter's name. So even after I taught the driver to read the rendered text, a whole class of error was still hiding in an attribute that reading the text can't reach.
One channel deeper: the real cause is in the console
"Your database generated a SQL exception" tells you THAT it broke, not WHY. The why lives somewhere a person clicking the dashboard will never look — the embedded iframe's JavaScript console.
Picking a value once returned ORA-00904: "table_count": invalid identifier — the actual Oracle error, the one that names the broken column. QuickSight never showed it. It went to the console, wrapped in a JSON payload QuickSight logs under "Stream error occurred." Another time a date picker silently failed to initialize and threw only "epochMilliseconds must be a number, you gave: null" to the console — the dashboard deployed clean and just didn't work, with the explanation sitting in a place the UI never surfaces.
So the driver attaches a console listener the instant the page is born and PARSES QuickSight's own undocumented error protocol off the stream (678cfafd, ba499869) — it regexes the "Stream error" JSON, pulls the entry whose type is ERROR, and lifts the real driver message out (it even strips the Oracle docs URL QuickSight helpfully appends). The commit note said it best: this turns hours of dead-end spinner-forever debugging into "look at the console output." An empty console capture is itself a signal — it means the listener ran and QuickSight genuinely logged nothing. (The epochMilliseconds one got the same permanent treatment as the duplicate columns: a date parameter now REQUIRES a default at construction, so it can't deploy in the state that only complains to the console.)
You can't even tell when it's done: reverse-engineer the WebSocket
This one took a real spike. To test a filter you pick a value and wait for the table to re-query before you read it. Except QuickSight gives you nothing to wait ON. There's no HTTP response when a parameter changes — the data layer is a single long-lived WebSocket — and Playwright's "the page went idle" primitive NEVER fires, because that socket stays open forever holding the page permanently busy. Wait for idle and you burn the entire two-minute timeout. Pick a value and read-after-a-beat and you catch the gap where the OLD rows are gone and the new ones haven't landed, read zero, and once again conclude the filter emptied the table.
So I spiked it: open the deployed dashboard, attach a raw WebSocket frame listener, pick a value and dump every frame with a millisecond timestamp. QuickSight routes every dataset query as a JSON text frame over that one socket — START_VIS{cid} to begin a visual's query, STOP_VIS{cids} once the client has processed the response and torn down its render pipeline. After a pick, the starts fire in a burst (+516ms, +547ms, +547ms for the three visuals on the sheet) and the stops follow as each lands. Then a SECOND burst fires around two seconds later — QuickSight's own debounced follow-up — so a naive settle returns in the gap between the two.
STOP_VIS is the signal nobody documented. The driver now tracks the set of started-minus-stopped cids and waits for it to drain to zero after a fresh start has fired, with a 300ms guard so it can't return in the dead air between bursts (076aa8cb). The detail that still makes me laugh: WebKit through Playwright only ever exposed the frames the client SENT — framereceived never fired once across the whole spike, so I literally could not see the server's half of the conversation. The render-complete signal is reconstructed entirely from the client's own teardown messages. The client wouldn't tear down a visual it hadn't finished drawing, so a message that means "I'm done with this" is as good as the response I couldn't see.
When the number is just wrong, ask the database what it ran
The deepest one gives up on QuickSight as a source entirely. Its nastiest failure — the one I wrote up in Death by Papercut — is a control that swears it's filtering while the dataset quietly binds the DEFAULT value, so the dashboard shows the full unfiltered universe under a widget that says it narrowed. No error fires anywhere; the number on screen is just wrong. I proved it by ignoring QuickSight and reading Postgres's own statement log — diff pg_stat_statements across a page load and you watch the query fire with the parameter bound to the sentinel default, never the value the control is showing. The UI lies. The query log can't.
Freeze the scene before QuickSight cleans it up
A silently-failing tool has one more trick: it recovers before you can look. The first version of the SQL-exception scanner raised an error and let the test framework take its normal screenshot afterward — by which point QuickSight had auto-retried and repainted, and the captured DOM no longer showed the error widget. I was triaging a crime scene that had already been cleaned up.
So detection and capture had to become the same atomic act. The moment a scanner fires, it freezes the full forensic bundle BEFORE it raises (52336b2b) — eight files per failure: the screenshot, the DOM with the error widget still in it, the error-overlay scrape, the console log, the network log, the WebSocket frames (the literal value QuickSight substituted, read straight off the wire), per-table row counts from the database (to rule out missing data) and a Playwright trace. The raised error embeds a short index of which file answers which question, so the next person down the hole — usually me, when the agreement test fails — reads the answer instead of re-deriving it. That WebSocket-frame dump started life as a one-off console.debug during the spike and became permanent triage infrastructure: the next "QuickSight's WHERE clause didn't match the value I picked" is read off the wire, not reconstructed by redeploying with print statements.
The last resort: drive the live thing by hand
Everything above is automated — scanners that fail loud and a capture that freezes the scene. But every so often QuickSight does something genuinely new and the only move left is to get your hands on the live product. That's one command: ./run_tests.sh triage <the-failing-test>. It stands up the whole stack — the database and a fresh QuickSight deploy — runs the test to the exact point it breaks and drops me into a Python debugger sitting ON the failure, with the live browser page in scope. From there I can screenshot the real dashboard, run JavaScript inside the QuickSight iframe, click a control and watch the re-query happen, or read the WebSocket frame history straight off the tracker — poking the actual product instead of guessing from its exhaust. It runs in a shared terminal session too, so a second pair of hands (lately an AI agent) can drive the same debugger I'm watching. When QuickSight does something I haven't seen before, that's the command I reach for — it turns "the test says it broke" into "let me go poke the actual thing."
The canary, and the renderer that can't lie
Two things sit underneath all of it.
Every dashboard's last tab is named "Info" and carries one real query — a count of the tables in the database. It's a canary. If that number renders, QuickSight's pipeline is alive and a blank visual elsewhere is a data or SQL problem. If the canary is blank too, QuickSight itself is the broken layer, (which happens and never seems to show on a AWS status page). It collapses a four-step diagnostic checklist into one glance at one tab. (It's named "Info" and not "i" because QuickSight hides single-character tab names — a free bonus paper cut I found while building the thing that finds paper cuts.)
And the reason any of this is bearable: one of those other three render targets is a self-hosted web renderer, and it surfaces errors for free. A failed query returns an HTTP 500, the page swap fails outright and the loading skeleton just stays up. The failure is structural — not a sentence I have to OCR out of a chart. I didn't build that renderer for its honesty (I built it to iterate offline without paying for a deploy), but its honesty is why I trust it as the thing QuickSight gets checked against. It can't hide a failure the way QuickSight can.
What it actually took
To test a tool that reports nothing, I tapped four channels it leaks errors through — rendered body text, a span's title attribute, the JavaScript console and an undocumented WebSocket protocol — then a fifth move that gives up on QuickSight and reads the database's own query log. Two DOM scanners of deliberately different shapes, one reverse-engineered wire format, eight artifacts frozen at the instant of detection, a one-command path to drive the live product by hand, a canary query in every dashboard and a second renderer to disagree with the first. Around ten commits across about seven weeks, none of which added a single feature a user will ever see.
That's the part of a closed BI tool that never shows on the pricing page. The sticker price buys you the renderer. What it costs you is everything you build so that when the renderer is wrong, you find out before your reader does. If you're picking a tool that can't afford to be quietly wrong, that's the number to estimate — and the only way I know to estimate it is to build the second implementation and watch how often the first one needs catching.
recon-gen is open source: github.com/chotchki/recon-gen. The scanners, the WebSocket tracker and the capture harness are all in the repo if you want the working versions.